NASA: Earth records hottest year ever in 2024

1.47°C warmer than mid-19th century
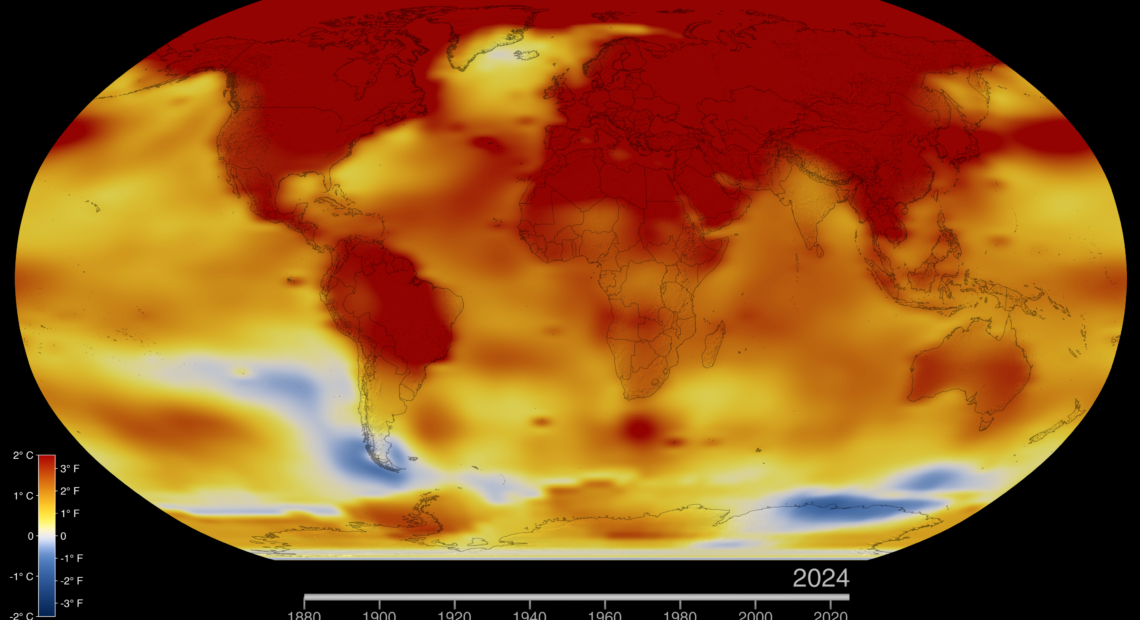
NASA has confirmed that 2024 was the hottest year on record, with unprecedented global temperatures. According to an analysis by NASA scientists, Earth’s average surface temperature in 2024 was 1.28°C higher than the 20th-century baseline (1951-1980), surpassing the previous record set in 2023.
This new record follows 15 consecutive months of monthly temperature records from June 2023 to August 2024, marking an unparalleled heat streak.
In addition to surpassing the 20th-century baseline, NASA scientists estimate that 2024’s global temperature was 1.47°C warmer than the mid-19th century average (1850-1900).
For over half of 2024, average temperatures remained more than 1.5°C above the baseline. With mathematical uncertainties factored in, the annual average may have exceeded this threshold for the first time. This marks a critical moment, as the Paris Agreement aims to keep global temperature increases well below 1.5°C over the long term.
Watch the video here:
NASA Administrator Bill Nelson said: “Once again, the temperature record has been shattered — 2024 was the hottest year since record-keeping began in 1880. Between record-breaking temperatures and wildfires currently threatening our centres and workforce in California, understanding our changing planet has never been more important.”
Grim predicament
Gavin Schmidt, Director of NASA’s Goddard Institute for Space Studies, offered perspective on the implications: “To put that in perspective, temperatures during the warm periods on Earth three million years ago—when sea levels were dozens of feet higher than today—were only around 3°C warmer than pre-industrial levels. We are halfway to Pliocene-level warmth in just 150 years.”

Human-induced emissions of heat-trapping greenhouse gases like carbon dioxide and methane have primarily driven the rapid rise in global temperatures over recent decades. The atmospheric concentration of carbon dioxide has increased significantly, rising from around 278 parts per million in pre-industrial times to about 420 parts per million today. This rise in greenhouse gases led to a noticeable warming trend, particularly pronounced in 2022 and 2023 when record levels of carbon dioxide emissions were recorded.
NASA and other US federal agencies consistently monitor greenhouse gas concentrations using US Greenhouse Gas Center data. This centralised data provides insights for decision-makers and offers vital information on emissions trends and their impacts on the climate.
El Niño effect
The intense El Niño event that began in the autumn of 2023 also contributed to the global temperature surge in 2024, though this phenomenon gradually waned as the year progressed. Despite the weakening of El Niño, the heat surge exceeded expectations, leaving scientists exploring additional contributing factors.
These include the effects of the January 2022 Tonga volcanic eruption and potential changes in pollution levels, which could have altered cloud cover and influenced how solar energy is reflected into space.
Gavin Schmidt underscored the significance of these trends, stating: “Not every year is going to break records, but the long-term trend is clear. We’re already seeing the impact in extreme rainfall, heatwaves, and increased flood risk, which will worsen as long as emissions continue.”
NASA compiles its global temperature records from data from tens of thousands of meteorological stations and sea surface temperature readings from ships and buoys. The agency uses advanced methods to account for variations in station spacing and urban heat effects that might distort the data. These efforts help ensure that the results are as accurate as possible, bolstering the reliability of the temperature records.
In a related assessment, experts from the Colorado School of Mines, National Science Foundation, National Oceanic and Atmospheric Administration (NOAA), and NASA confirmed the accuracy of these records, which are also supported by independent analyses from other organisations such as NOAA, Berkeley Earth, the UK’s Hadley Centre, and Copernicus Climate Services in Europe.
These studies have shown that global temperatures in 2024 were the highest since modern record-keeping began in the late 19th century, and there has been a consistent global warming trend.
Schmidt noted: “When changes happen in the climate, you see them first in the global mean, then at the continental scale, and finally at the regional scale. Now, we are seeing them at the local level. The changes in people’s everyday weather experiences have become abundantly clear.”
As the warming trend continues, the world will experience an increasing frequency of extreme weather events. Future temperatures and climate patterns remain critical areas of study and concern.
Hero image: This colour-coded map in Robinson projection displays a progression of changing global surface temperature anomalies. Normal temperatures are shown in white. Higher-than-normal temperatures are shown in red, and lower-than-normal temperatures are shown in blue. Normal temperatures are calculated over the 30-year baseline period 1951-1980. The maps are averages over a running 24-month window. The final frame represents global temperature anomalies in 2024. Credit: NASA


