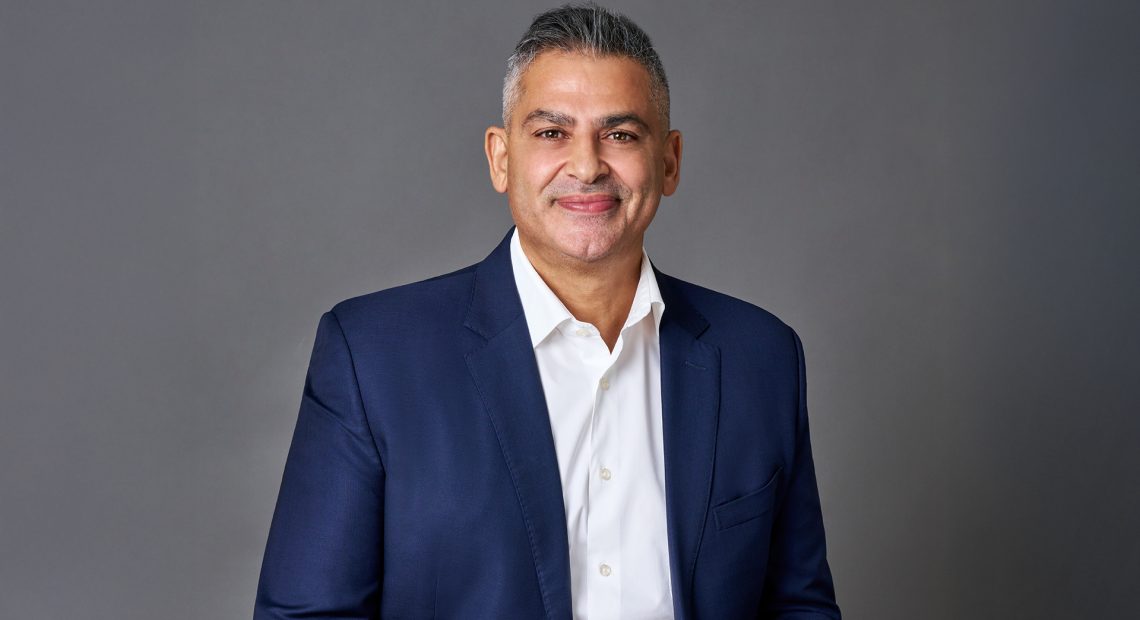
Key Insights by Cherif Sleiman, Chief Revenue Officer, Property Finder:
Waterfront developments have become one of the most powerful real estate contributors to the UAE’s economy, and our September data shows that the opportunity now stretches across all four emirates rather than sitting in Dubai alone.
Abu Dhabi recorded the strongest rise in typical asking prices of any emirate, up 21% year on year, while typical asking prices at The Crescent on Palm Jumeirah, Sharjah Waterfront City and Saadiyat Island rose by almost 40%, 21% and 13% respectively.
These projects add value to the economy through several channels at once. They bring international capital into the country, generate sustained construction activity and support a wide network of contractors, suppliers, property managers and service providers long after handover. Once complete, they create permanent jobs in hospitality, retail, leisure and facilities management, and the residents and visitors they attract spend in the local economy every day. That combination is exactly what the UAE’s economic diversification depends on, with real estate, tourism and hospitality working together as a single engine for growth in each emirate.
Waterfront addresses also carry a clear price premium, and it varies sharply by emirate. On Palm Jumeirah, the typical asking price of AED 9 million is four times the Dubai-wide figure of AED 2.25 million. On Saadiyat Island, the typical asking price of AED 5.65 million is roughly double Abu Dhabi’s AED 2.73 million. At Sharjah Waterfront City, home to Ajmal Makan City, the typical asking price of around AED 3 million sits about 60% above the Sharjah-wide figure of AED 1.85 million, while on Al Marjan Island the typical asking price of AED 2.6 million is around 24% higher than the AED 2.1 million figure for Ras Al Khaimah as a whole.
That premium reflects scarcity, direct access to the sea and beach, and the hotels, marinas, dining and leisure that come built into these communities. Each emirate is attracting high net worth residents and international investors with a distinct offering. Dubai remains the global benchmark for ultra luxury: typical asking prices at The Crescent rose to AED 22.2 million, Signature Villas on the Palm recorded a typical asking price of AED 78 million, and the emirate’s five leading waterfront locations had more than 20,000 properties listed for sale between them. Abu Dhabi pairs beachfront homes with a world class cultural district on Saadiyat Island and with theme parks, motorsport and major events on Yas Island. Sharjah offers waterfront living at more accessible price points, with typical asking prices in Al Majaz at AED 870,000 and steady growth in areas such as Al Khan Lagoon, up 12%, and Al Mamzar, up 7%. Ras Al Khaimah offers resort living at scale, with more than 5,600 listings on Al Marjan Island and typical asking prices rising steadily in Al Hamra Village and Mina Al Arab, up 5% and 3% respectively. The same qualities that attract residents also attract visitors.
Waterfront communities combine homes with hotels, beach clubs, marinas and restaurants, which turns them into destinations in their own right, drawing visitors throughout the year, encouraging longer stays and keeping tourism spending flowing into hotels, retail and leisure. Looking ahead, we expect waterfront development to remain a key driver of growth across the country. Dubai will continue to set the standard at the top of the market, Abu Dhabi is seeing the strongest price momentum of any emirate, Sharjah is proving that waterfront living can combine strong growth with accessible prices, and Ras Al Khaimah is building resort communities at real scale. As more high net worth individuals choose to make the UAE their home, the waterfront will remain one of the most important engines of growth, tourism and investment for every emirate and for the country as a whole
Waterfront Development Overview
| Emirate | Unique Sale Listings | Total Asking-Value Footprint (AED) | Average Asking Price per Listing (AED) | YoY Average Value Growth | YoY Average Price Growth |
| Dubai | 199,616 | 1,129.7B | 5.7M | 26.42% | 7.14% |
| Abu Dhabi | 23,013 | 99.3B | 4.3M | 16.95% | 21.11% |
| Sharjah | 40,690 | 152.2B | 3.7M | 80.51% | 6.18% |
| Ras Al Khaimah | 14,576 | 78.6B | 5.4M | 44.39% | -6.25% |
Dubai Waterfront Developments
| Top 5 Locations | Unique Waterfront Sale Listings | Average Sale Price Per Listing (AED) | YoY Growth |
| Palm Jumeirah | 4,870 | 24.2M | 1.12% |
| Palm Jebel Ali | 1,131 | 30.7M | -28.13% |
| Dubai Marina | 6,440 | 4.7M | 0% |
| Dubai Harbour | 2,943 | 9.1M | 3.52% |
| Dubai Islands | 5,143 | 5M | 5.5% |
| Locations | Top Developments | Unique Sale Listings | Average Sale Price Per Listing (AED) | YoY Growth |
| Palm Jumeirah | The Crescent | 1,749 | 22.2M | 39.78% |
| Dubai Harbour | Emaar Beachfront | 2,172 | 5M | -3.77% |
| Palm Jumeirah | Signature Villas | 137 | 78M | 4% |
| Palm Jumeirah | Garden Homes | 238 | 50.5M | 17.44% |
| Dubai Harbour | Sobha Seahaven | 276 | 8.5M | 23.76% |
Abu Dhabi Waterfront Developments
| Top 5 Locations | Unique Waterfront Sale Listings | Average Sale Price Per Listing (AED) | YoY Growth |
| Saadiyat Island | 2,983 | 5.7M | 13% |
| Yas Island | 4,618 | 2.8M | 0% |
| Al Reem Island | 6,325 | 1.9M | -1.97% |
| Al Hudayriat Island | 1,404 | 5.4M | -34.4% |
| Al Jubail Island | 302 | 11M | 0% |
| Locations | Top Developments | Unique Sale Listings | Average Sale Price Per Listing (AED) | YoY Growth |
| Saadiyat Island | Saadiyat Cultural District | 1,209 | 4.3M | -1.04% |
| Saadiyat Island | Saadiyat Lagoons | 544 | 9.5M | -3.06% |
| Al Reem Island | Shams Abu Dhabi | 1,880 | 1.8M | 5.88% |
| Al Reem Island | Najmat Abu Dhabi | 874 | 2.5M | -26.47% |
| Yas Island | Yas Acres | 349 | 7.8M | 7.22% |
Sharjah Waterfront Developments
| Top 5 Locations | Unique Waterfront Sale Listings | Average Sale Price Per Listing (AED) | YoY Growth |
| Sharjah Waterfront City | 2,319 | 3M | 21.14% |
| Al Majaz | 877 | 870K | 16% |
| Al Khan | 3,238 | 1.2M | 1.77% |
| Al Mamzar | 1,605 | 1.5M | 7.41% |
| Al Heerah | 182 | 3.5M | -0.29% |
| Locations | Top Developments | Unique Sale Listings | Average Sale Price Per Listing (AED) | YoY Growth |
| Sharjah Waterfront City | Ajmal Makan City | 2,316 | 3M | 21.28% |
| Al Majaz | Al Majaz 2 | 183 | 725K | 15.08% |
| Al Khan | Al Khan Lagoon | 453 | 1.3M | 12.33% |
| Al Khan | Maryam Island | 1,463 | 1.2M | 0.04% |
| Al Majaz | Al Majaz 3 | 514 | 922.5K | 12.5% |
Ras Al Khaimah Waterfront Developments
| Top 5 Locations | Unique Waterfront Sale Listings | Average Sale Price Per Listing (AED) | YoY Growth |
| Al Marjan Island | 5,602 | 2.6M | -8.76% |
| Al Hamra Village | 2,966 | 2.1M | 5% |
| Mina Al Arab | 4,127 | 1.8M | 2.86% |
| Al Mairid | 358 | 1.8M | -10.71% |
| Ras Al Khaimah Waterfront | 74 | 2.1M | -18% |
| Locations | Top Developments | Unique Sale Listings | Average Sale Price Per Listing (AED) | YoY Growth |
| Al Marjan Island | Marjan Beach | 92 | 4.4M | N/A |
| Mina Al Arab | Hayat Island | 1,289 | 1.5M | -5.44% |
| Al Hamra Village | Falcon Island | 747 | 3M | -1.67% |
| Al Marjan Island | Treasure Island | 14 | 247.5M | 164.71% |
| Al Hamra Village | Waldorf Astoria Residences | 69 | 20M | N/A |